Thursday, May 21, 2009

USDCAD - Look out below!

I've entered a short position in USDCAD. Why? Why not. The pair is at a major support level, a daily support level. I entered a few days ago, so I'm in profit and waiting to see what happens, and the best part is that I'm giving the market lots of room to move around, waiting for the decline.

Here are my previous thoughts on this pair, and where it would go
Notice on March 9, 2009 how the pair did penetrate the 1.3000 level and faked out breakout traders. Didn't I mention using a tight stop in an earlier post? I hope you didn't get caught on that one.
As I stated in an earlier post, I think the run up was due to the need for USD. Hedge funds had big clients who wanted out of the market, they could see the domino's falling after October of last year. To cash these guys out, the holding needed to be liquidated to some extent, including holding on non-USA markets. When they liquidate those holdings, the currency must be changed back to USD, so that drives up the price. There are clearly more forces at work than this, but I like the simple approach, all I need is in the price. And as I also stated before, understanding why something is happening is the downfall of many traders. You will know why many months later.

Credit Crisis and PUT option
If you do some creative searching on Google, you will find that there were those that shorted the market using PUT options before the credit crisis was public. Click on the link above to get started. So here is what I'm saying, you might have noticed this happening, and allot of traders did. How many acted? Notice the forum article, the writer is trying to figure out why? Who gives a rats ass why. Keep that in the back of your mind, like a dart in your back pocket, take it out when you need it. If you saw the market take a shit kicking like it did on November 8, 2008, you might have thought to wait a few days for a bounce, and pick up some PUTs. Or, you might have not because you wanted to know WHY? and didn't make a killing like the traders who sunk billions into PUTs. So, why ask why?

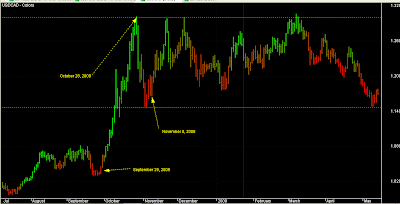
Looking at the charts below, notice on September 8, 2008 the USDCAD started to rally. Is this the impact of liquidating large amount of holdings? The pair tops out on October 28, 2008. So what do you think about that? At the time you would be asking yourself, why is it running like that? Stop asking, and make the trade. Even the hammerheads on CNN, BNN, and all the rest don't know what is going on. If they did, it would news.

Back to the USDCAD. It doesn't matter why it went up so fast. All I know is that the chart is telling me to short it. Be careful, manage risk, keep your capitol for another day if you are wrong. But if it cracks this support line, where is the next support? Keep looking down.

The other possibility of course is that it bounces a little and stays in this channel for the next 80 years. I'm playing the decline.

Here are the charts. Notice the daily support level at 1.1463 TO 1.1350.

Above = Daily chart
Below = Hourly chart

Sunday, April 19, 2009

Tipster Trendlines v2.1

This page is out of date, click "Tipster Trendlines" at the top of the page.


Trade directly from your Amibroker charts. This AFL code allows you to draw three lines on the Amibroker chart and place an error free trade. You must have Amibroker 5 or better, IBController (from Amibroker website), Trader WorkStation (TWS) and an Interactive Brokers (IB) account. I have not posted the code at this time, but for a small $20 donation I will send it to you.


Tipster Trendlines v2.1 from Another Brian on Vimeo.


Tuesday, April 14, 2009

Trading Rules

I got these "rules" off another site, same old stuff.... throw up a few rules, make them general, hopefully the reader will buy the course they are selling.

Here it is:

Forex trading is really just about buying support and selling resistance. It's easier said than done, but here are some easy rules to follow:

Buy low sell high [ya, OK.]

Do not assume support and resistance even if there is precedence; let candlesticks indicate market sentiment at anticipated levels and act accordingly. When in doubt, let the market test and retest price levels. [and then what do I do?... I watch smaller time frames, sometimes a tick chart....but that if I'm trading off the H1 or H4.]

Apply a moving average as a simple visual way of indicating trend then buy support or sell resistance in favour of the trend [and what time frame are we talking about here? And what moving average period? How about just using higher highs and lower lows? Works for me.]

Retail speculators often get the big picture right but get killed by volatility at the lower time frames; increases chances of success by following the big picture more and this is really about 15 minutes or higher. [I agree with this, just ask Ryan O'Keefe!]


To sum it up, play with the trend, follow the big picture and apply wider stops that are more tolerant. That will really save you from a lot of nasty whipsaws but you will get it right when price reverts to the mean. In terms of strategy, nothing beats a simple one so you can get it right even if you wake up on the wrong side of bed. [I agree with this to, but it's general and doesn't really help a new trader]


Anyone have any comments on these so called "rules" that are more guidelines than anything....

Saturday, April 11, 2009

Tipster Trendlines - version 2.1

This page is out of date, click "Tipster Trendlines" at the top of the page.


The "free" version is no longer available. Go to the Tipster Trendlines 2.1 post for additional information.I've modified the code for my Amibroker interface to Interactive Brokers (IB) Trader Workstation (TWS). All the functionality is now on one pane.


The user puts three horizontal lines on the chart called "BS", "TA", and "ST". Bracket orders can be placed and the code will check to ensure the bracket is correctly setup. You can also disable this bracket order feature and place only a "BS" (Buy Short) with or without a stop or target.


The Risk display is only an approximation for forex, and I have not tested it for futures.


The menu's are all drop down now. Here are some sample screen shots. I'll make a video when IB is online, their server are shut down until Sunday evening.


Friday, April 10, 2009

Better Video

I just signed up with Vimeo and uploaded version 1 of the Tipster Trendlines video. I think this site is better for this video since you can watch full screen and the quality is better.


Tipster Trendlines v1 - Amibroker and IB from Another Brian on Vimeo.

Tuesday, March 31, 2009

Finviz

If you trade stocks there is a website worth looking at. The only thing wrong with it is that it doesn't include Candian stocks. Take a look at this video tutorial of the site. I'll be using it to find sectors and groups that are leading the charge for the next bull. Conglomerates have had a great run over the past few weeks on this strong surge of buying. Lets see if the pull back is lighter compared to the other sectors and groups. Once I find the sector or group I'll look in the same place on the Canadian market. This is for the RRSP (retirement fund in Canada), a long term approach. I'm in one bank stock and one enrgey stock right now with a bunch of cash, sitting and waiting.

On to the video, if it asks for a password -> finviz

Another short tutorial about BigCharts.

Sunday, March 29, 2009

Other blogs worthy of mention

I find it takes so much time to read and digest information available on the net to find the sites that are actually worth while to visit on a regular basis. Here are some sites that I visit that offer more than just hype.


MACD High Probability Trades - I noticed that MACD High Probability Trades has taken to forex. He has switched his trading from stocks to forex, stating that forex is the new thing. I look forward to reading his blog posts related to forex.

DailyFX - FXCM's news, analysis and signals web site. Pretty good but I prefer the forexfactory calendar for news releases. It's on the sidebar of the blog.

ForexProject - Not sure what happened to Rich. Last word he got a new job. I think he should spend less time making websites and more time trading. His web sites are great though!


Alphatrends - Eben though this is related to forex, I watch his daily videos and I've read his book. Price action is all you need. Watch a (single) tick chart when price is near support/resistance and you'll see what I mean.

TradeTheMarkets - The free videos are helpfull. Although I have never paid these guys anything, there site is worth a mention. I signed up for the free videos. Here is a nice one - the them is - when daytraing, only take trades in the direction of the trend (60 min trend in this case).

Ryan
has been helpful - If you cant daytrade forex, then swing trade it. Read this guys blogs to figure it out. He has two blogs, his own and one on fxstreet

Saturday, March 28, 2009

USDCAD Poll

Previously I have posted my thoughts on USDCAD forex pair.

Shown below is the recent chart. Using all your skills, vote on which level you think will be breached first, the 1.3000 zone or the 1.1800 zone.
Vote on the poll - it's located at the top right side of the blog. Also, feel free to say your piece on the pair, commenting on this post.

Breakthrough

It's been a while since I posted. Here's what I've been doing, and not doing....

I haven't been working a whole lot on the updated version of Tipster Trendlines but it is close. I sent the code to a reader (David) who is testing it. David had some good ideas to improve the flexibility of the code. For example, the ability to submit a bracket order, or just a buy/sell order, or a buy/sell with a stop. Also, the menu's have changed with everything on a single pane.

Since the beginning of the year I thought I'd concentrate more on actually trading than coding trading systems reading/writing blog posts, and actually gain more experience trading every day.

Also over the past few months my frustration with IB's data feed has grown so I decided to try another broker for forex trading while still not closing the IB account. My issue here is that you cant get tick data. If I use another feed to Amibroker and IB to trade forex the two may not jive enough to scalp and/or place my stops. So I think we are kind of stuck with IB's crappy data feed.

I've opened a new account with MFGlobalFX to trade forex. I think they are an affiliate of FXCM since I can log onto the dailyFX website for news and signals (more on that later).

Their simple little platform is really all I need, I found to my surprise. I plot a few MA's and display a daily, H4, H1, M1, and tick chart to trade. Once I figured out what I wanted to see and what indy's I wanted to on my screen, trading was more simplistic. I only use price, MA's, slow Stochastic, and a table of ATR values. The platform is FXTradingStation by CandleWorks, does anyone else use this? The indicators are written in a language called LUA. I'm not about to dive into another language to port some indicators. So back it is to Amibroker. How do I get this new brokers data into Amibroker? ... more on that later....

Using this little platform made me think a little after I has some successful trades. Amibroker allows us to over complicate things. This simplistic approach helped me get my head around the trading plan that I needed to simplify. My plan was more than 10 pages and I really wanted a 2 pager, something I would memorise without even knowing it, something short. Also during that time I listened to a TraderInterview. This particular trader made up a simple "table", I call it a matrix, of his set-ups. He would detail the set-up for the applicable time frame and how to initiate a trade and possible profit targets. It is well known that a trader needs a few set-ups to draw from in order to flatten the equity curve, and this is a good visual tool to do that. This trader also scored the set-ups for each trade, promoting good set-ups and "firing" the under performers. Promoting just refers to increasing position size for the set-up. So this was my road map to simply my trade plan and my charts.

Back to the new forex account.... After I opened the account, I tried trading on the demo to figure out the platform. Easy stuff. Trade right from the charts. Then I went back to IB's TraderWorkstation and tried demo trading from the chart trader. Again, this was easy but the charts are not as nice but I can see through that by adjusting the colours. The worst part of IB chart trader is the lack of a tick chart. I have found scalping and setting trailing stops as my position moves to be so much easier with a tick chart.
Today I fired up the DDE link to FSXM with Amibroker and the data is now streaming. So at least I can set up some alerts to email me when price is getting close. If you are using FSXM and the FXTradingStation application let me know what you think of it. I was also wondering about sharing templates for that app, haven't found anywhere that does this.
This is the breakthrough. I ready to dump back tests and auto pilot systems for now. I've got risk management under control and I know my limits. A have some set-ups that I'm comfortable using. I have two issues left to solve and one is data availability / easy charting package, the other is to get comfortable with larger stops. The second will come , I think, with a larger account size, its all about percentage on the irsk side. The frst issue, charts, should be completed by Sunday night once the streaming quotes start to come in. I'll probably use Ami to look at tick data and some home grown indy's and use FXTradingStation for all other time frames and to place the trades. Tracking trades on FXTradingStation is also easy. I'd post chart shots bu the app wont open on the weekends when the servers are offline.
I'd be interested in knowing if anyone else uses a combination of Ami and FXTradingStation or Ami and FXCM to trade forex. What has your experience been?

Monday, February 2, 2009

Who is TMK?

Quite a bit of testosterone stirred up over at The Market Kid (TMK) blog. If your not familiar with this blog, it's written by someone, nobody really knows who, that claims to be a kid. Some speculate that he or she is a high school student. "Kid" probably refers to a kid of the market, a child, a constant learner, anybody follow me here with this?

What's he do?
TMK posts penny stock picks, basically following the Timothy Sykes program. Look for shitty stocks that move up quickly on no news or bullcrap from the forums and look to short when they fizzle out. Sure, pennies can be a bit risky, and that's why you should have your money management system in place and following it. Pennies can be fun to play and profitable but you need to set up your rules and play the game to the rules or your going to get hammered like a hockey player with his head down crossing the blue line. ... game over, lights out.

Educational?
Is there anything to learn from this "TMK" blog? Sure there is. Look up some of TMK's past picks and judge for yourself. Even better, use the past picks and make some rules up, then simulate the trades. ya ya, no shares available, whatever... the point here is you can use the blog to grease your wheels.... do your own work... but it sure is easier having someone narrow down the thousands of stocks to sift through.

Is he a fraud?
You might care, I don't. We all trade differently, we all judge people differently. If someone were to take the posts, which are apparently the result of scans and preliminary manual chart scans by eye, and put their own trading strategy to work on them, and found some they could actually trade, and make a profit from the posts, who gives a rats ass who the hell TMK is? Not sure about you, but I'm in this for the money, and to learn about myself and how i react to in different market conditions (think trade journal)

What the point?
I want to make money trading, not friends, not enemies, not contacts, just cash. Who is MKT? Who gives a crap, but whoever writes the post isn't a teenage high school nerd. This person has some market insight and has either taken a course or two, spent hours reading through all the bull on the Internet, or is old enough to have been in the game for a while. TMK has probably watched the Sykes videos a few times, and read his books. There are legitimate blogs on the net by people that makes money day in and day out, and I ask you, do you trade their picks ? and make money from them? do you lose money also?

You are the master of your account. You are the master of your mouse. You are the master of your mouth. Do whatever you want. Blow up your account. Read blogs repeadadliy that you dont like. Blast your mouth off like anyone else values your opinion, to make sure everyone knows that YOU are RIGHT!! We all crave to be right, and isn't that why most people do terrible in the market?


I'm too busy trying to take some coin out of the market to give a rats ass about MKT's personal life or the comments some of his reader leave. When I sift through the comments, I simply look for MKT and read that part.... but sometimes the filth gets interesting, and we all like to read that crap sometimes, don't we?

Remember this
When the bell rings, your not my friend, I'm trying to take your money.

Saturday, January 24, 2009

Currency Interest Rates

Now that I'm using the daily and weekly charts, with an entry planned off the 4 hour chart, I need to think about the interest rates of the various currencies.

Many brokers will credit or debit your account on overnight forex positions.
Interest is calculated using the difference between the two currency interest rates. For example if you trade Euro Dollar, the ECB (European Central Bank) and FED (Federal Reserve) are the banks you would need to look too for the current rates.. If the ECB's rate is 2.25% and FED's rate is 4.25% the difference is -2%. A long (buy) position on Euro Dollar will generate a 2% debit interest on your account, a short position will generate a credit interest of 2%.

To show you the impact of this, here are a few examples and a link to use this currency interest rate tool. This is also know as the carry trade.

You need to know what will have an impact on your trade, and what the impact will be in order to make an informed decision. Using the chart below yo can see that the interest is minimal for most small trades, but of coarse this depends on the pairs, the rates, and the length of time you are holding the trade open.
I'm using this tool to narrow down the pairs I will be trading, and noting in my trade plan the desired trade to be on the right side of the interest rate. This will help me make my decision to trade the pair without having to goto the tool every time. Part of the weekly ritual is to update that table, for the pairs I have chosen to trade.

1 week for $30,000


1 weeks for $100,000


4 weeks for $30,000

Thursday, January 22, 2009

Forex Trade Journal

A Trade Journal is part of my trading plan. A comment was recently posted about journals so I thought I would share part of my journal. I plan to share the excel version once there are a few more trades in it. I started a new journal not long ago when I decided to do forex on the daily chart, explained a bit more below.

In books, on blogs, in the seminars, the experts tell you to keep a trade journal. Notice it doesn't read "trade log". The journal includes all items you would find in a "log" and more. You can read about journal all over the net. I have begun to trade forex daily and 4 hours charts with a simulation account using various set-ups. The only thing better than my little journal would be to actually print out the chart when entering the order and writing your thoughts on the chart as the trade progresses. I don't have a very good printer so I don't do that.

My journal started with a few column's and I have added and adjusted these as I went along. I wanted to not only record the trade details but also the reason I entered (what was the set up), the adjustments along the way as I checked the chart each evening, and once the trade closed I recorded my thoughts and comments on what I did wrong or things to watch out for in the future.

Here are the current columns I use.

Pair
L/S
Order Type
Entry
Reason for entry
Status
Exit
Pips of profit
Date of Entry
Date of exit
Days in trade
Mod 1
Mod 2
Mod 3
Mod 4
P/L
Review of Trade and comment on result

Make the journal your own. I review mine after each week, both the current week and the prior weeks. This makes it stick in your memory.

Saturday, January 17, 2009

Are you ready to quite?

There is a forex trader named Ryan O'Keefe. You may have visited his blog. He has a post up about traders who have started out with great intentions and have almost blown up their account. If this is you, your might be asking yourself is "Are you ready to quit?".

Even if you're not ready to quite, this is worth a read. The theme is simple but not stated. When your having a rough go at it, make your trading plan simple, dumb it down. Trade only one pair, use only one system, trade a demo for a bit, talk to someone about your trading if there is anyone available.

The biggest problem you'll have with this is patience and waiting. If your trading only one pair and one system, you may go quite some time, days or weeks before you get a signal. This is part of the training. Wait for the right time. If you miss it, wait for the next one.

I use a trading journal, it is a royal pain in the ass.... but I fill it out as soon as I enter an order, when the order triggers (now I'm in the market), as the trade progresses (still in the market, recording my thoughts as well as target and stop adjustments and why I made them), and when the trade exits. Once I'm out I look at the chart, using hindsight since it is 20/20, to see if I read the situation correctly, and managed risk effectively. I have noticed that the losses that hurt the most were the ones that I had placed the stops at a point to far away for my comfort zone.

Where to place the stop and target? This pretty much defines if I get decide to enter or not. I identify the target and initial stop first, if the risk/reward ratio is less than 2 I don't consider it. If it is greater than 2, I now look at the position size. Here is the problem I had with this.... IB has a minimum order size that I'm not comfortable with for some trades, the stop placement would be too much of a $$ loss. So I opened an account at MBtrading, they allow smaller lot sizes. I haven't placed any trades on their system yet. One I start it up I'll post some trades and ideas.

So the whole point to the post is to "get back to basics" and follow the rules you made up in your trade plan. That is why I am reading my trade plan tonight, and every other night, until it is burnt into my brain.

Good trading!

Friday, January 16, 2009

USDCAD

Remember this post of the USDCAD?
Price dropped to resistance that can be clearly seen on the weekly chart. I've shown 3 support / resistance levels with the white lines. After the third push to 1.3000 price fizzled down to the middle white support line and bounced.... twice. We are now in a channel. There are several ways to play this. Here are a few ways to play it at the 1.3000 level.
1. Buy once price goes over 1.3000, stop just under that level to your taste, and depending on how much of a bet your placed.
2. Buy as price approaches 1.3000 looking for it to quickly snap through 1.3000 for a quick profit, riding the momo and using a trailing stop. This method would work for you if you think it will be hard to get in once it snaps through the level.
3. Wait for the break, then the pullback. I won't be doing this since I don't see the USD and CDN being more lopsided than it is right now. But the market doesn't care what I think.
4. Don't play the upside. I'll be waiting for the upside break, but I don't think it will happen. I expect the bottom to be the favoured direction.
To get past 1.3000, there will probably need to be some sort of catalyst. Having said that, watch for the bottom white line to be broken for a downside move.
I should note that this is based on daily and 4 hour charts. I will not go deeper than a 4 hour chart now trading forex. I have scaled down my position size and will trade based on daily and 4 hour time frames. To scale down my position sizes I've had to open up another forex account at a different broker since Interactive Brokers minimum size is too large for me to use with wider stops.


Thursday, January 1, 2009

Wednesday, December 17, 2008

Free eBook for everyone! - How to find free books online

Yet another effective way of minimizing capitol depreciation by NOT paying for books.

If you have been reading this blog for a while you might remember the post about how to find books on line for free. How to find free ebooks is the topic once again. The post was on Tools for trading education. Read it after this post for a complete understanding.
Recently I wanted to read a book and did a quick search for the title. (This post will not use specific book names in the text as there are often searches done to find websites that show others where to find this material. I will give you the tools, you find it yourself!!)
To find almost anything you want, use the Google advanced search. Check out the screen shot below that shows how I searched for the book. Here is the Google advanced search.


... and the results, see the "visited" link?


Here is the link to the advanced search page results from Google, a link for an ebook, go to the second page down near the bottom. You will quickly find a link to the pdf.

Here is yet another trick if you have made it this far. Right click on the google link and select "copy shortcut". Paste that into the address bar of your browser and then remove the last part of the link that is the file name. Then hit enter. This will, in most cases, show you the contents of the directory. In this case, you are presented with a long list of books you might be interested in reading. All you need know is a cold beer and a large monitor. Enjoy!


Wednesday, December 10, 2008

Tipster Trendlines - v2.1 being finalized

I've just sent the latest code (v2.1) to three others who offered to help get it all working. For the most part it works fine, just needs some calculations for the risk panel. I've tried to make it determine risk based on user selection of stocks, futures, or forex.

There are a few other brand new features too.

With the extra help, this shouldn't take to long.

Tuesday, December 9, 2008

How to Trade from Work

Don't want IT to know what your doing online? Trading, cruising porn, chatting, whatever you want to do, do it like you were sitting in front of your home computer. All IT can see is that you are accessing a remote computer, they won't know what your doing. It's your own proxy server!!

Use Windows Remote Desktop. This video takes you through a high level of setting this up. Sorry for the crappy quality.

Here is a resource for
Remote Desktop Q&A.

An excerpt from the above:

Q. What port does Remote Desktop use? Does everything go over port 3389?

A. Port 3389 is the only port you need to open. Windows will attempt to stream sound through User Datagram Protocol (UDP) first. If no port is available for UDP, sound will stream through a virtual channel in Remote Desktop Protocol, which uses port 3389.

Q. How do I connect Windows Desktop Client to a remote port other than 3389?

A. In the Computer field in the Remote Desktop Client connection dialog, specify the port in either of the following ways:
• Computer name, colon, port number
Example: TSComputer: 22229 • IP address, colon, port number
Example: 192.168.1.1: 22229


Monday, December 8, 2008

USDCAD


Interesting chart pattern on the USDCAD. Triple top with an ascending wedge. A triple top gives it a bearish feel but the pattern is not valid until it breaks lower support. The ascending wedge gives it a bullish overtone. Since we don't have volume to add to the clues, we can only use price action. Notice the buyers were not waiting to buy shown by the lower lows. Also the lower lows get closer together, so they are also not waiting as long to jump in. On the other hand, look how fast price jumped off the top resistance line, telling us all kinds of sellers came in, plus its a big super fat round number (1.3000).

Buy on a break over 1.3 with tight stops, it either goes like a f'n canon, or fakes out and reverses back into the channel.


On a break out, you could also put in a short stop order below the 1.3000 line to catch the fake out on its way back to the bottom of the channel.

This is the type of pattern I would use breakkouts on, not channel trading. The converting to USD might be over, then again it might not. Use price action to guide you. Don't enter at the middle of the channel, enter at the top or bottom, this allows you to use tight stops, control risk, and have an edge.

Wednesday, December 3, 2008

Trading from work

There is a poll on the right side of the blog, "Do you trade from work?"
Do you? Take the poll.

If we take these results, we can see that 54% of the responders want or actually do access there trading account from work. Here is what I'm getting at; Does anyone want to see a video of how you can do this without the IT department knowing what your doing? There is nothing illegal here. You just have to know how technology works to be able to avoid the "tracking logs". Make no mistake, you will be a part of the log, but it wont show up that you are using TWS or WebTrader, or continually accessing your brokers web page.

You may be think, he is using a proxy server. No, that's not it, but close. So, do I have your attention? Take the poll first, then leave a comment.

Currently, this is what the poll looks like:

Tuesday, December 2, 2008

Good Reading and Video

In my opinion, support and resistance with momentum are the way to trade. It involves the alignment of the trend on multiple time frames. You may have heard this before and it is difficult to put it to use. But it is like anything else, you need to practice. Practice makes you remember the rules. We have all heard that we should find something we are comfortable with and stick to it with discipline. If this is your style, all you need to do is pick the smallest time frame from which you want to trade. Use three time frames. I like to use the weekly, daily, and hourly to pick where I will enter.
The following video by Brian Shannon will help you understand this concept. If you want more reading, buy his book. He doesn't over complicate things, he makes it gumby pokey easy to understand. In case you don't know this because you've been living under a rock for 2 years, Shannon was the head of training at MarketWise for some time. They are a very good trading training firm in the US. Previously I have mention Sam Seidens work who also works for them. Shannon is a full time trader now. Buy his book. It is good for any type of trading, even forex. (If you use this link, I actually get paid a dollar or two).

In addition to this, if your interested in forex, read this PDF. It explains things pretty well at a high level. The "rules" and description of discipline and money management are honest, not a bullshit bunch of crap that is usually written.
One more thing before the video. Read this post to understand more about support and resistance. It explains the Gap & VWAP. The VWAP is the volume weighted average price.

The video below is timeless. I watched it three times to memorize the info. If you can memorize it, you will do better. Think of your job, and how you just "know" what to do day in and day out. You know it becuase you have done it so many times. Use a demo account, that will help memorize the info and required action. Again, watch the video a few times.


Wednesday, November 26, 2008

Tipster Trendlines - Update

This page is out of date, click "Tipster Trendlines" at the top of the page.


A quick update on the code; I haven't had much time to work on the code, not to motivated with the market jumping all over the place. I'm spending most of my "market" time evaluating my RRSP holdings. I'm also testing a strategy on the simulated account for longer term forex trades, s swing trade time frame from a day to a few weeks.


I hope to have the code ready in a week or two. Is anyone willing to test and give me feedback?

To qualify you need to know how to program in Amibroker, I'm looking for some help to test and tweak the code. Any takers? Drop me a line at my email, in the top right under "What this Blog is all about"

Monday, November 10, 2008

USDCAD Trade

A video of a set up I am playing tonight. It looks like the USD buying might be over, or paused for now. If the markets break out, the USD probably wont move any higher. In any event, this trade is basically a small scalp that demonstrates my Tipster Trendline code for amibroker.


By the way, go see Brant's videos at http://www.trade-guild.net/ if you want another view of the market.

Wolfe Wave - look for them

A while back I received an email from a reader (Michael) who stated that he uses wolf waves as one of his tools, and with some success. I have done some reading on wolfe waves and understand them to some extent, and I've even noticed the pattern a few times while trading. They are, like most patterns, obvious after the fact to the extent that you know if they were profitable or not.


The way I interpret the pattern is that it is a counter reaction to an over reaction. In other words, when price moves to fast in one direction, it often moves back quickly in the opposite direction. The catch is the entry in the wolfe wave. It gives you a relatively low risk entry to reward ratio. I see the pattern quick often in the volatile forex market. Take a look back on your charts and see if you can spot some of these. Better yet, slowly scroll forward and draw the lines as the pattern emerges, see if you get faked out or if you profit. And the same goes for any pattern, understand why it works and what the emotions are that are behind it and you will see it better.


I asked the reader if he would like to have a post here on wolf waves so we could better understand the pattern. Michael recommends a book called "Streetsmart" as it explains the pattern very well.


Here is Michael email (edited slightly):


There are two types of wolfe: one for going up, one for going down. so long and short. The key of the analysis is to discover 5 points and the last point 6th is the target


For Long:
Point 1 and 3 are the downside points, the 3rd must be lower tha 1st
Point 2 and 4 are the upperside points, the 4th must be lower than 2nd and higher than 1st.
When the trend goes to form the 5th point, which is lower the all the previous 4 points, and then begins to move up, you trace a line from 1st to 4th point, which gives you a projection to another point, the 6th point, which is the target.


So if the movement is right, price should go up and you make a huge gain. The stop can be placed below the lowest low, and now you can see the profit potential.


For Short, it is just contrary of this. I have enclose several pictures so you can see what I mean, one picture is worth a thousand words.


Sunday, October 26, 2008

Tipster Trendlines - things to come

The "free" version is no longer available. Go to the Tipster Trendlines 2.1 post for additional information.

Here is a short video showing you what I'm working on next for the Tipster Trendlines code. The code is not yet 100%, when it is, I'll post it. If you have any comments on what is being planned for the next version, leave a comment.

The new version will feature drop down menu's and trigger buttons right on the chart.

Enjoy!

Wednesday, October 22, 2008

What do you think is going on?

This post is not meant as investment advice, it's purpose is to spark some comments and discussion.

What's your opinion on what the market is doing? Why all the volatility? Why the melt down? Why is the US dollar going nuts? What's up with the huge drop in oil? Why are great high dividend yield blue chip stocks taking a hit? Here are my thoughts;

Liquidity seems to be the issue. Investors were, and still are worried that the firm they have their money invested in will go bankrupt, or worse, the firm they have there money in has invested in some other firm that goes bankrupt. Either way your funds would be locked up in a bankruptcy and that's not liquid. This has caused people (or those on wall street) to cash out, stocks, commodities, everything. You never saw this coming did you? Wall street did, that's why there was a huge drop to begin this mess. Read the user groups on the early questions on the put volume of some of those firms that bit the dust. People were trying to figure out if they were buying or selling puts. Looks like they were buying puts and made a huge, huge killing on the firms that went tits up.

Why is gold not going up since it is the safe haven? Cash. Everyone wants cash. The biggest cash nation, rather richest nation is the USA. That's where the credit crunch started. Funds are liquidating investments world wide causing all indexes to fall from the massive selling. Once they sell a stock in a foreign country they must then convert the currency back to USD. The USD is going full tilt in an uptrend. I think you can almost compare currencies to see where the biggest exchange of funds is happening to some extent. In Canada, the oil and commodity prices are also killing us, that impacts the Canadian dollar. Why are the commodities dropping such as metals and gold? Liquidation.

This is going to be a long healing process, not a quick snap back to the market. The volatility is probably due to huge amounts of money being moved around, not the norm for the market. To end this, the mass amounts of cash has to be moved to the US and invested elsewhere.

So what is next?
When the time comes, when all the cash is back at home in the USA, who knows what will move. The first sign will be the indexes stabilize, then slow decline in the USD, then accelerated decline of the USD against the Canadian dollar, oil will rise, and whatever the US giants invest in will rise. If a recession is coming, look for a rise in recession proof stocks. The USD will cease to rise since there will be no more buyers.

What am I going to do? I'm going to try to ride the USD higher. When it snaps the uptrend, short away. But be careful and manage risk. The market will start to settle down and into a trend when the normalcy again, weather its a bear or bull market.

That's my theory. What's yours?

Saturday, October 18, 2008

Globe and Mail and the way forward

This is a look at the past, the present, and the future.

A while back I was contacted by the Globe and Mail and asked to participate in the "Me and My Money" column. The column is below, click to enlarge. The paper version has a fairly large picture of me playing my guitar, very cool.

Larry MacDonald also mentioned me in his own blog, where he discussed day trading on the TSX. Anyone else out there day trade the TSX? Technically, I'm not day trading since I don't watch the screen during the day. I put my order in at night, it could trigger the buy and sell in the same day, thus called a "day trade". Below the article I describe what has changed since then.

Page 1


Page 2


Something has changed since the article was written. I have moved all of the RRSP accounts that hold mutual funds to a discount brokerage. IB does not offer RRSP, LIRA, or RESP accounts so I went elsewhere.

Why did I do this?:

First of all, I had my funds in RRSP's for the same reason most other people do, not enough time to manage it and for the long term I felt the pro's would do a better job. For the most part this might be true. The single issue I have with this is their ability to exit when they smell something rotten, such as a declining 50 day MA, even worse with a declining 200 day MA. Even if they knew a few US firms were about to implode, how could they liquidate a fund of that size? Who cares. I know I could liquidate my holdings in a blink of an eye and not cause any market movement.


The long term plan:
First of all, cash is a position. Decide for yourself when to get in and get out, before your emotions take control. Here is my plan. After reading a book about a guy who purchased solid dividend paying companies, and retiring, I decided to go on my own. I will only purchased companies with that meet certain criteria, the top two are "must pay dividends" and "from the chart". There is more to the dividend research than that, just like there is more to the "chart" than that. Basically, dividend paying companies in an uptrend, or at support.


How has it worked so far? Pretty good. In the past few weeks some of the fund transfer was complete so I went on a search to find some stocks on the TSX. (I wasn't about to buy on the US exchange as the CDN dollar has been beaten up lately). One of the stocks that I set up an order for was BMO. All four stocks had limit orders set up, set up at prior support. I figured it could take up to 4 weeks to get a fill if the market was going to be ranging. To my surprise, the very next day the market got killed. All four orders were filled. Scary you might say. It turned out pretty good. Patience to wait for the price was a key, after all, it's long term. Here's a chart, my fill price is the white horizontal line.

BMO.TO - Weekly


BMO.TO - Daily


Notice that there is a triple bottom, and each bottom on the weekly chart has less volume, that's good. As far as risk management for this trade there are two options.

First, if the price breaks that support - get out quick, usually a fourth test of a horizontal line is like a hot knife through butter.
Second, set the stop at my break even while considering any dividends received, perhaps setting the stop a little lower for breathing room. I'm looking at the close prices before I place a stop order.
Third - never sell. Strange thing to say but at the white line it is 7.5% yield. Better than a sharp stick in the eye.

So lets sit back and see which way the market heads. The path of least resistance is down. To be back in an uptrend we need higher lows and higher highs. Or we could range for a long, long time. If you want to see what a bottom looks like (it's hardly ever a V on a daily chart), check out today's video at alphatrends.net. Also take a look at this Bear Market Post to gain perspective. Yo be your own judge. If your confused, put your money under your mattress and wait for the bullets to stop flying. Cash is a position. If you know what your doing, follow your trade plan.

One more thing - I almost have a working version of an updated tipster trendlines with more bells and whistles. This one has trigger buttons and drop down menus right on the chart. Should be ready in a week or so. Is anybody using version 1.0 or 1.1 of the code to trade with?

Saturday, October 4, 2008

Chart Trading Question

A reader emailed a question about the tipster trendline chart trading code that I thought would be beneficial to others if I posted it. I'm not offering any advice or opinion on the set-ups profit potential, only how the code works and IB's order triggers.

"I attached a graphic, in which you can see, on 1st of Oct. I wanted to short IMS, on breakout of the bottom of the previous candle, but as you can see the candle of 1st of Oct, is a strong up candle. My stop order of sell should not trigger, and my buy stop (which is my stop loss) is set to 12.39$, so what happen in IB."

Line BS is the buy stop order. The price must go below this level for the order to trigger. This is the "Parent" order.

Line ST is the stop loss order. This is a child order, child of Parent order "BS". This order is will not trigger until the Parent order triggers (BS).

Line TA is the target order. This is a child order, child of Parent order "BS". This order will not trigger until the Parent order triggers (BS).

So in this example, if the BS order was a "DAY" order and not a "GTC" (Good 'Till Cancelled) order, at the close of Oct 2 the order BS has not triggered, therefore ST and TA will not trigger. At the close of the day the orders will automatically disappear from TWS and you would not have a position.

How does this work in TWS? To see how this works, left click on the coloumn titles of your order page inside TWS. You need to add a field called "OCA" (One Cancels All). The Parent order (BS) will be blank. The two child orders (TA and ST) will have the same numbers in the field.

When you set up a bracket order manually within TWS, this is basically what TWS is doing for you. You can also do it manually. Try it manually to learn something. You can also use this technique to capture a breakout of a range, such as a squeeze in price, if you want to catch a move to the upside or downside. I haven't played with this type of order very much but I'm sure it can be done so that when you get a break in one direction, the orders for the other direction are cancelled.

Friday, September 26, 2008

Risk Management

Risk is job 1. Patience is job 2. What the hell does that mean?

Patience is important for entries and exits, jumping into trades to early, not waiting long enough for the price to run, can be counter productive to the outcome of the completed trade. I think this goes without saying but it's harder to do in real time than most think. This post is not about patience, I mention it only as a comparison to risk being job 1. Risk can be managed, and should be to avoid your "hope" that price will follow.


There are poeple who make a killing from "pump and dump". The people who buy once its hyped, and do not sell even though the price keeps declining, are 'hoping' and are not controlling risk. You would think that the stock is purchased prior to the pump by the insiders. It is, but it is also shorted at the crest when no more buyers show up. Watch the volume, that shows you how many people are at your party. When the party gets lame, leave and look for a new one. Easier said than done for most. Use bracket order to control your risk, thats one method.

Rather than write about what I mean by risk, here are some posts on the topic.

The 2% Rule
Position Sizing - Bull Trapper
Position Sizing - Trader Mike
Position Sizing Spreadsheet
R-Multiples

Another source is a book called "Trade your way to Financial Freedom", or "Technical Analysis using Multiple Time frames" . To search for books that may be available on the net in pdf, take a look at this post "Tools For Trading Post".

I developed a screen that shows me how much to risk based on the account balance.
I use some afl code in Amibroker I developed with the help of some code from the Amibroker Knowledge base web site. The starting code had nothing to do with risk. It is using Amibrokers new graphics commands and allows you to put buttons and graphics on the screen, the same area as the price plot. The code is a bit rough around the edges but I post it so you can at least have basic functionality. I plan on making it much more robust shortly. The final version will not be shared though, unless the is a contibuton made.

There is two parts to this code. First, a chart to draw lines. Second, a pane that has code to display risk, profit, etc. The first chart with the lines writes the static variables of entry, stop, and target as well as the ChartID and order of lines (long or short set up). The second retrieves the variables and some information from your Interactive Brokers account and computes a bunch of information automatically for you.

Here is a video that explains what it all is and the code. I also explain some of the basic of the bracket order; how it triggers, how it cancels, etc.


Part 1 - To use the code, you need to draw 3 (horizontal) lines on your charts to define entry, stop, and target. That code can be found on the post titled "
Tipster Trend lines Post"

Part 2 - The second chart, or pane, or code snippet is right here. "
Risk Management Code"


Wednesday, September 24, 2008

Michael'sScreen Shot

Here is a screen shot from Michael. His version of "nothing special" is a simple screen.

I have heard that the two most valuable assets for a trader is screen time and discipline. Screen time is your ability to see price action without indicators. Over time I have noticed that you get a better feel for charts and price action by simply watching it live. Try this to see what I mean; look at a chart of the S&P or QQQQ every half hour throughout the day, keep notes every half hour on what you see and where price might go next. Note support and resistance lines. What you get from this is a timeline. You understand how long it takes for things to happen. If you can't do this at work, than watch a different market such as Australia stocks, Forex, or Gold.

Michael writes:
This is my screen shot, as you can see it is nothing special, I use at most two indicator like PPO and ADX for detect HDIV and DIV and pattern like Wolfe Waves.


Michael is also preparing a guest post on Wolf Waves, we look forward to that post.

Short Interest

If you use Short Interest as part of your strategy, I draw your attention to a recent comment.

"If you're doing this sort of thing for a living, then you need more timely information. Here's a site that provides that for a nominal cost:

http://www.squeezetrigger.com

He also states that he does not how good the info is. I haven't done any digging but as far as I know the short interest for stocks is release twice per month by the NASDAQ exchange and I'm not sure about the NYSE. Therefore, I doubt the info is more timely than anywhere else, but it might be for other exchanges. If anyone knows, please share.

Tipster Trendlines

Thanks to Murthy for additional code for the Tipster Trendlines, trading from the chart.
He has added functionality that tells you if your lines are off the viewable chart area along with some other functionality.

A new version of Tipster Trendlines is available.

The "free" version is no longer available. Go to the Tipster Trendlines 2.1 post for additional information.

Disclaimer

The information presented on this site is for educational and entertainment purposes only. This site contains no suggestions or instructions that you must follow, do your own research and due diligence before committing your cash to the markets. Your on your own.