Thursday, May 15, 2008

Scan - for May16, 2008

I was going to post the spreadsheet but excel is not working right. So here is a screen capture.

The data from Yahoo is available sometime after 8pm, so it's usually after 9 or 10 by the time I get around to scanning. I have Amibroker set up to scan, then I select the stocks I want by quickly looking at the charts (sometimes the scan gives me charts that look a little wobbly). Then I add the ones I want to a watch list. From there I look for the best one to set up. Once I find them, I have a screen where I draw 3 lines and click a button to send them to TWS (IB's trading application). Then I just have to go into the trading application and set up a condition and transmit the order. It might sound like lots of work but it's not. The condition I place is a buystop (for longs).


Trades

Here are two trades I'm in right now. These both appeared on the recent scans I posted. On the charts, green is a long entry, black lines are stops and targets.

Stops and targets are changed daily, these are the entries yesterday. Tonight I will adjust the stops and targets based on intraday charts.

The good, the bad, and the ugly will be updated once I exit the trade.

RIG


The good: Profit. 1% risk, followed entry rules, placed stop. The stop moved up the day after the trade to above break even. In the trade 3 days.
The bad: Profits taken too soon, but this was the plan. I haven't completed setting up my entire trade plan, specifically the exits. I have three target ideas - use MA's with a coefficient, use ATR, use a target that is only in reach in case of a huge gap up (unlikely), use resistance levels (could be far in the past, so perhaps too weak to worry about?) , don't use a target, only a trailing stop.
The ugly: Good lookin' trade, considering "the bad"

LLTC
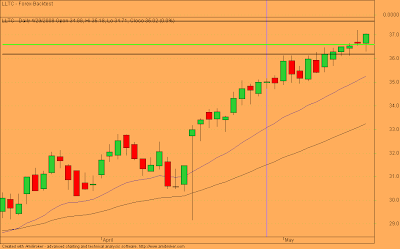
The good: Still in the trade, moved stop to break even.
The bad:
The ugly:

Support and Resistance

Here is a great article on Support and Resistance. It's by Sam Seiden of Online Trading Academy. I receive emails from them periodically.
You read about this concept all over the web, and in books, but I have never seen it explained like this before. He explains WHY it works, and more importantly, what to look for. Time does play a role, the amount of time price spends at a price level while bulls and bears kick each other in the balls and struggle for control. This article has not only helped me understand where the low risk entries are located, but also where to place stops more effectively. If I looked to place an intraday stop, sometimes I looked at support and thought it would be at cluster lows. That was probably not the best place to put the stop. As explained in the article, look for areas where price spent the least amount of time. This is where the buyers/sellers stepped in big time to snatch up any offerings, and with one side dried up, prices moves fast. Read this article several times and understand the concept. Memorize it so you don't have to think about it. Thinking, not reacting, can get you into trouble.

Support and Resistance, a Deeper Understanding

Often, I talk about supply (resistance) and demand (support) in articles. I use simple examples and pictures to help explain how markets work and prices move. Today, let's take our level of understanding to a deeper level by actually simplifying the picture of quality support and resistance, the way we do in the classroom during the Professional Trader Part 1 and 2 courses . I was recently reviewing the pages in the stock class, and came across a page that showed what I considered something very close to the perfect picture of support (demand) and resistance (supply). The message that page conveyed to me was something I want to share with you here in hopes of improving your level of knowledge and understanding.

Price and Time: Price spends the least amount of time at price levels where supply and demand are out of balance. Price spends the most amount of time at price levels where supply and demand are NOT that out of balance.

In other words, price levels on a chart where price spends the LEAST amount of time are where the most quality trading opportunities are found. What this picture looks like on a chart is a pivot high and a pivot low, NOT a cluster of trading activity. Let's have a look...

Notice the turning points on this stock chart. If you focus on the pivot high point in the upper left portion of the chart, that provides for solid resistance when price returns to it on the 29th. That is a quality supply level. Notice the demand (support) level on the bottom of the chart, the pivot low on the 29th. Price shoots up from that level because supply and demand are so out of balance. Price spends so little time there because demand greatly exceeds supply. When price revisits that area two days later, that is the time to buy as price is revisiting a quality demand level. Next, notice the circled cluster of trading from the 28th. Price declines from that area and when it returns to that level, it moves right through it like a hot knife through butter. This is because supply and demand are not that out of balance, the cluster of trading tells us so. The fact that price spent more time in that base than it did at those pivot high and low points tells us that the great supply and demand imbalance is at the pivots, not the cluster of trading. While I may show these clusters in letters, they are for understanding. For application of support and resistance, pivot highs and lows are where the greatest imbalances are found.
Let's go over the turning points in this forex chart. Notice pivot high area "A". We call that a "pivot high" because price could only stay there for a few minutes. Why? Because supply (resistance) was so much greater than demand at that level. "B" was the first time price revisited "A" which was the low risk/high reward time to sell short. Area "C" on the chart is a pivot low. "C" happens because of a major supply and demand imbalance. There are so many more buyers than sellers that price can only stay there for a few minutes, creating the pivot low. The first time price revisited that level was the time to buy "D" as the risk was low and the reward was high. Next, notice "E", the cluster of trading that is followed by a decline in price. When price comes back to that level for the first time at "F", it goes right through it without turning lower. This is because of the time issue. Price spent more time at "E" than it did at "A" which is why "A" is a higher probability shorting opportunity (turning point) than "E". The same issue is true at "G". The cluster of trading provided no support when price revisited that level at "H". Again, time is the key issue here which is why the pivot highs and lows are the low risk/high reward support and resistance levels, not the clusters of candles.

Wednesday, May 14, 2008

NASDAQ Scan

Given that the market is at a long downtrend resistance level today, I thought it would be appropriate to post a scan of stock that are in trends. The scan clearly shows the up and the down trending stocks. The scan attempts to filter only those stocks that are experiencing a pull back.
What does the scan look for?
It uses linear regression, force index, and a few other goodies. The close must be greater than 5 and less than 100 (no reason only that I don't want pennies). The volume (20 period MA) must be greater than 250K. Once this scan is run, I look at the charts to select the potential candidates. Typically I like to buy on momentum, using buy stops (for longs).

Performance: To see how this scan performs, I ran it on past data. The FIRST scan shown was run for April 24, 2008. I selected this date as it was in the middle of an uptrend in the Q's (QQQQ).

The SECOND scan shown is run on today's data.

All the symbols are not shown. If you like the scan and want to see more of them let me know and I'll post excel sheets so you can see all the symbols. If I get no responses, I'll probably won't it anymore.
April 24, 2008


May 14, 2008

Saturday, May 10, 2008

Some great tools for trading... education

In this post I'll give you some tools you can use to obtain videos, blogs, websites, books to help yourself. Make sure you follow the law and don't' abuse any copyrights. Your on your own, know what your doing and be responsible.

Videos
Have you ever watched a video online and wanted to save it to your hard drive? Most online videos these days are streaming, and they don't save to your "temp" directory like they did only a few years ago. Back then you could go to your temp directory and copy the file and re-play it. So what do we do now? There are two options, you can play the video and use a screen capture program similar to the ones these guys use on there blogs to make there videos at
Alphatrends, Trade-Guild. The problem with this is you have to have the video player open and you can't do anything else while recording. Also, if there is a hang-up or delay in the stream, you going to record it. The better way is to use a streaming video capture program that captures the digital stream, behind the scene and while you work on something else.

I tried quite a few video download tools to find most didn't work well. The best one I have found is the cheapest, "FREE". It's called ORBIT and you can get your own copy right
here. You can even schedule downloads and control bandwidth. So while you at work, where the bandwidth is HUGE, you limit the speed your downloading at so you don't raise any IT heads.

I have download videos from FXCM, Alphatrends, Optimize101 and 201 for Amibroker, MACDots system, all kinds of videos. I load them into my MIO UPS and watch them in the car on the way home from work. Well, I don't actually watch them, I listen to them. I also download mp3's from TrederInterviews and listen to them on the way to work/home.

Here is a portion of my library right now - click to enlarge. If you want some of these, I was thinking up opening up my FTP site. Depends on how many people ask for them.


Blogs and Websites
Have you found a website or blog that you want to spend time reading but can't find the time? Do you want to archive your blog? Do you want to save a copy of someone else's blog to your hard drive for reference? Do you want to save a website to your hard drive so you can read it while sitting an an aircraft? Here is the tool for you... your going to have to read the help a little to get the right results, it will only take 15 minutes or so.


HTTrack


Books
So you want to read some books. First off, don't go and buy them. Search Google for them. There and many PDF books out there, all you have to do is find them. Check these out, this is just part of what I have found. Once I find the book, I print it double sided, with 2 pages per side of paper. Instant book.


Go to Google and use advanced search.
Here is a sample page, make sure you use filetype to return only PDF's


Hope these tools help you. Let me know!

Taking a break, making the plan

I have been taking a break, since work is keeping me busy. I am shifting, or rather opening up to other markets now. I have written a trading plan that includes the pairs I will ONLY trade in Forex. There are three pairs, non correlated and all USD's. I am also opening up to the TSX, trading the ETF's and highly liquid stocks. Prior to using IB, I was with E-Trade, this was a few years ago. I found that the profits I made were all eaten with commissions, that to much, that money could have been in my pocket. Since switching I was intoxicated with the though of auto trading and switched to Forex. Well, here is my long term goal:


Trade the TSX with daily charts and intraday triggers, set up on TWS. At the same time, trade Forex intra day in small lots. As the same time, work on the automated trading system that will trade on a 1 hour time frame, from Monday to Friday, from 11pm to 8am EST.


Does anyone think I should share and post my trading plan?

Disclaimer

The information presented on this site is for educational and entertainment purposes only. This site contains no suggestions or instructions that you must follow, do your own research and due diligence before committing your cash to the markets. Your on your own.