Monday, March 31, 2008

EURUSD


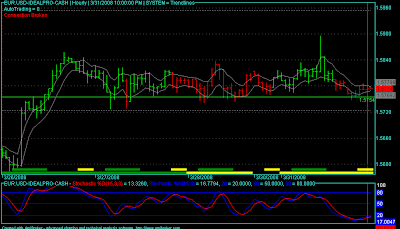
The green line is where I have set my buy order, at the bottom of the consolidation, with a tight stop shown as the dotted grey line. Target set for 200 pips. If it triggers and goes higher, my plan is to monitor it each night looking for signs of weakness. My trading plan has always been that once I am in, the first objective is to move the stop to break even when I see a higher high form on a reasonable time frame, most likely 4H in this case. The target is set only to get hit on a large spike, from an event such as news. When the momentum slows I will place the target closer to catch all I can while the stop will also move tighter. I look for momentum to slow from the STOCH, prices coming off the top of the bands, or volatility increases, making lower lows. I use the volatility to have the target hit. If the climb is steady, I like that and I stay in. The trick is to catch the steady climbers.


Note that none of these post are recommendations. I am entering these trades in the blog to capture this moment. I'll come back to each post and do an "UPDATE" as the trade close and add my thoughts. I want to track my progress for these daily time frame "swing" trades, or hopefully "trend" trades.

UPDATE:
The Good: Position size set, Stop placed, Target placed, trade planned before placing trade.
The Bad: Took a loss, a small loss.
The Ugly: Totally forgot about the first friday of the month. The US released the non payroll farm report. I was reading about trading the news just days before this trade and noted that I have to commit this news release date to memory. I think it will stick in memory now!

Correlation and Sentiment

This post includes some useful information I found at Mataf.net. An interesting feature they have is called the sentiment calculator that allows the user to determine sentiment of the various pairs by looking at different time frames of charts and selecting up, down, or sideways trend. Once you pick all the choices it tells you what you entered. An easy way to determine the trend yourself without any bias.

The chart is the last one in the post. This correlation table supposedly update with time as it is a link, not an image.


Sunday, March 30, 2008

USDJPY Trade

Pulled the trigger on a short of USDJPY.

The stop is on the chart, above the recent high, shown as a grey dotted line. I'll trail this one, current target set at 90 just so I have a target.
UPDATE:
The Good: Position size set, stops set up with order, trade planned before placed. The trade went the right direction to start with
The Bad:Took a loss. Stop set up to far away, didn't wait for the right time to enter. With the entry, the stop stop could have been tighter.
The Ugly: I think this quick move was from the US non farm payroll report. I was reading about trading the news days before this trade and I should have known better. If the trade went my way though, I would have been claiming victory right?

Watching the Daily Charts

Aside from my quest to have a system work while I sleep, work, play, etc. I want to put my technical skills to work for some trading off the daily time frame. Back when I first started downloading Forex data and looking at the charts, and researching what exactly a "pip" was, I was mostly day trading and swing trading stocks. I learned this all myself, with a few courses, offered free to try to get you to sign up with the brokerage firm. I have no problem with high pressure sales tactics, they don't other me and I can exit the establishment without feeling like I hurt anyone's feelings. It's business, and in business, people either get screwed or they do the screwing. I prefer neither so I go for the free pizza and learning session, notepad in hand. Back to the subject.... I first downloaded Forex data so I could develop a system, and I didn't like all the gaps in the stocks. Since then, I have found that stocks, sectors, Forex, bonds, all have their own behaviours and different tools work for each. I have also found the daily time frame to have much less noise and are far less "jerky" than the hourly charts.

This post will list my thoughts on four pairs, and where I interpret the charts to be headed. Some I will actually put real money into.
The dots and circles on the chart or just to provide me with some basic buy/sell areas. They have to be used with the trend.
USDCHF

Downtrend, recently broke 1.00, and bounced back to 1.00. I'm looking for
consolidation around this level before it drops hard. I'm not playing this
looking for the drop, the chart doesn't tell me it's going to drop. The 1.00
level is importnat because it's "round" and "par". This time it cracked it.
(Look at USDCAD when it cracked par 9/20/2007). I'm watching it to come back to
1.02 to test the high, watching the STOCH, and watching my 5EMA trigger when the
time comes. One potential outcome is for the STOCK to drop below 20 and sit
there as the pair heads south, if this happens I'll be looking at riding that
sled to the bottom of the hill.

USDJPY
A short is setting up. It broke 100, a nice round number and 100 has became
resistance. This level has been support since 1999 and now that it has been
penetrated, it is resistance. I'll be shorting this soon, looking to catch
100.40 so I can set a tight stop. If I miss the move, there will be others and I
will learn from it.

GBPUSD

Looks like its going into consolidation for a while on weekly, making Lower Low
and Lower High (see chart). I'll be looking to short at 2.0021 to 2.0026. On the
daily, it looks like it could make its way up to the higher high. Stoch is on
the way down, a good signal might be to wait until Stoch gets to 20 then short
for the start of the downtrend using a tight stop. The yellow line is
resistance. The hollow red circle is a sell signal, if I was watching this I
would have shorted at the low the day before the hollow circle appeared.


EURUSD

Weekly - no signal - good counter trend short, I don't play that game though.
Daily - huge uptrend continues, wait for pull back, wait until Stoch gets to
below 50 then buy on strength on the break of a daily high, also watch the 5EMA
system for triggers.

Forex Video

Here are a couple of videos that I find useful.

1. MACD Video
2. Where to get Forex Information

MACD = A trend-following momentum indicator that shows the relationship between two moving averages of prices. The MACD is calculated by subtracting the 26-day exponential moving average (EMA) from the 12-day EMA. A nine-day EMA of the MACD, called the "signal line", is then plotted on top of the MACD, functioning as a trigger for buy and sell signals.

Here is an educational video done by Brian Shannon at AlphaTrends.net He explains the MACD and how to use it. Good review if you don't have things memorized. The MACD is one of the ost verstaile indicators.

PFX Global has a good video that describes where you can get Forex related information. It sure is easier to watch a video than weed through all the information on the Internet and figure it out yourself. If your not going to take a course or have a mentor, this is a good place to start.


Wednesday, March 26, 2008

Trendline Trading

I have updated my code to include a trailing stop. When I see a possible set up, I can now set the "Study" in Amibroker to send two complete orders to IB. The first has a defined target and stop, better known as a bracket order. The second submits a buy at the same price with only a trailing stop. This will get me a quick profit and also let an order run with the price. Here is the window I use (Param window) to set it up.

I'm considering sending the order once I set up the lines, that way it's sitting on the IB system. Currently the order is triggered with the real time data on my screen, then sent to IB. There are advantages to both, not sure what the better way to do this is. I'm getting the hang of trend lines, and trading 15 minute bars with tight stops just doesn't work. Using the hourly with small position sizes and wider stops is the way to go, compared to what I have been doing. What have I been doing? Using a 10 pip target and stop. I'm figuring out the best method to obtain a positive result using STOCH and a 5 EMA of the highs, and a 5 EMA of the lows. The success rate is pretty good with the 15 minute chart. I have also added some code as a count down bar timer, this is good to have when scalping for 10 pips. Here is what my screen looks like even trying to keep the clutter down. Below I'll explain the screen shot.

The colored bars are a system in itself, I don't use the signals for automation, I use it for "watching the screen trading"
I set up the "Study" lines, green for buy, red for short, as solid lines. When the order is triggered the profit and stop lines turn grey, this tells me the lines are not active and locked out. I can also go to the menu and press "Lock-Out" so a trade will not be triggered for buy or short. I can also select "scale-out" to use the trailing stop feature. With more options comes more clutter. The plan is to figure out what suits me best, suits my style best and remove everything else.

Right now I'm scalping some evening (EST) USD.JPY and setting up night time trades for EUR.USD. So far it's break even with real money. This blog is one way to record how I'm doing instead of keeping a log. Perhaps my next posts will describe some trades, both good and bad, so I can track what my thoughts were and what worked. Haven't decided on that yet.

Friday, March 21, 2008

A Trading System

Much has been written on trading systems. I have tried many and found that the advice given by most honest traders is fitting, that is, the system has to fit well with the person. One such system is shown in the screen shot below. I was reading the latest post by Rich over at Forex Project and the comment section began a long topic of systems discussion. It was a discussion about trading systems and one trader offered up his charts. The discussion is very interesting, and should be read. I noticed that the chart looked familiar to one I use. All I really had to do was change the period variable. Read it here - Want To Buy a Forex Trading System?

I don't use this systems now, I stick to S/R and a 5 period EMA on the 1H or 4H charts. The top chart is mine, the lower chart is from the post at Forex Project.

This particular chart is from comment No. 16.


Tipster Code Above


System posted and discussed at Forex Project.

Friday, March 14, 2008

Breakouts

What is better, indicators or trend lines, what has better results for an auto trading system? I have tried, as many others have, to use indicators to buy and sell Forex. It works about half the time. Why not just use a random number generator to trade then? What about breakouts?

Look at a 5 or 15 minute chart, how far is 10 pips in relation to the average bar length. How hard can it be to make 10 pips? It's harder than it looks. My next system involves breakouts and trend line trading. Here's the idea;

I set the chart up with 1 to 4 lines, when the line is crossed it trades, setting stops and targets, and gets locked out until I reset it. I can use horizontal or sloped lines to do this in Amibroker (AB). The code I have done so far works OK. I'm amazed how how simple the code was to do this. The "system code" is very small compared to the auto trading interface code need to talk from Amibroker to TWS via the IBcontroller. I'm waiting for the bugs to show themselves. I was surprised when I was testing this, I would trigger it to test signals and next thing I know I'm hitting the profit target of 10 pips.

I can't find many others that have coded this or auto trade this way, I searched with Google and found very little. The AB Knowledge Base doesn't have much either. If you trade Forex this way I'd like to chat via email, drop me a line. Email link is at the top of this page.

Disclaimer

The information presented on this site is for educational and entertainment purposes only. This site contains no suggestions or instructions that you must follow, do your own research and due diligence before committing your cash to the markets. Your on your own.