Showing posts with label Forex. Show all posts

Sunday, April 27, 2014

Crossfader EA - Gold - Safety Lines

There have been many ideas tabled on saving the mighty trading account from CF when she turns against you. 

I have been using two charts with one set for buys and one set for sells.  The idea was that the sell trades could start even if the buys trades were active.  I was hoping to see the drawdown controlled.  Not sure why it doesn't work so well, I haven't spent much time examining that though.  Most likely because CF holds losers and take profits quick (no runners).

I had another brain fart the other day.  How can I manually control DD, and not sit and ‘hope’ price returns.  As I was looking through the sub-forums at SHF to decide where to post I ran across varso using a 45 pip stop (MPTM).  It seems to work for him.  My idea is almost the same!  We all know that trading with the trend is the way to go, but there are problems with that.  Which time frame is the trend you should be following?  The trend for CF should probably be the 240 or max the daily for a couple of reasons, first, CF uses a 240 stochastic, and second, when a basket starts, and depending on how many maxorder you are allowing, a price reversal could last a long long time.

Picture this - Price has been ranging on the daily for weeks and CF is happy to make Buys and Sells inside this daily range.  Now you enter a few trades, I've notice 4 to 6 in a ranging market on the 1 hour TF or 4 hour TF then price snaps against you.  CF enters more trades, price keeps ranging and snapping against you.  "Snapping" is the term I use when price surges in the direction of the trend.  In a downtrend, if you look at the chart you see price slowly drifting up, then all of a sudden it hits a level that everyone wants and BOOM, you have a lopsided market and price moves fast.So what I'm going to try is to limit drawdown by turning off Buys or Sells once price passes a certain spot or level. 
Here is the research I did to arrive at the solution.  I'm going to use AUDUSD charts as I have trades shown on it.  Now remember,  none of these trades had any drawdowns I couldn't deal with.  The trade starts are marked with lines
Here is the daily, notice the daily trend is strong down - didn't matter, CF made coin.  We'll zoom in after this chart.
audusddaily
Below is the hourly of the same pair
audusdh1
Both directions made money - look where the buys are made in this downtrend, pullbacks and consolidation.  If the pullback is weak or the consolidation not strong what happens?  You get hammered.
Here is a picture of what getting hammered looks like.
EURUSD Buys in a down trending market.  This is the hourly - clearly headed lower. Everything looks good until the recent buy, notice the pullback was weak and we get smashed.

 eurusd-h1-ava-financial-ltd-2
In this case - you could have drawn a line at the top of the range and call it "SellBelow", CF will only enter sell trade when price is under this line.  In my version, I will also add to the logic, once price goes over this line all sell orders will be closed.  Then get back to trading with a profit.
I don't know if this will work.  I've looked at the trades CF makes (myfxbook charts the trades) and this approach should work.  You could even follow the pivot points on the chart if you wanted too. 

How would I prevent this?  here is the idea.
Draw a line on the chart, a line in the sand.  Actually, draw 2 lines.  A green line and a red line.
Buys are only allowed ABOVE the green line, so you can trail it up if you want too.
Sells are only allowed BELOW the red line, you could trail this down if you wanted too.

One more thing - if there are open Buy orders and price drops below the green line, I close the basket.
So now I don’t have to worry about having two charts open, or having stupid large drawdowns.  You could even use SAR as your trend switch here instead of lines, SAR is more automatic.

Back to the first chart - where to put the lines?
On the downtrend, I plan to use the red line and the green line on a 1 hour chart to start.  The safe way to go in a downtrend, just turn off the Buy trades, chances are on your side that you wont get killed.  You wouldn't even need these lines.  

These are my Safety Lines.
So go ahead and draw the lines on the chart, the problem is if you change the timeframe CF needs to reload, I'm not sure if this is an issue or not.  Go to a 1 hour TF, put the red line above the high that price would have to get to and make the strong downtrend weak.
Here's an example (yes, hindsight is 20/20)
The red lines I show, the bottom right of each line is "when" I would move the line
The green lines - as soon as the Buy (long) trades are started, I would move the green line.  If you wanted “rules” – then as soon as the first trade is entered, draw a line.  You have lots of time to do it before you get smacked.
The yellow box below shows you the current Buy trades that are getting hammered, and where this system would have exited.
eurusd-h1-ava-financial-ltd-2-lines

If you are familiar with supply and demand you shouldn't have a problem with this.  I'm going to try this and I'll keep you posted.  I won't be near a computer for a few days, so don;'t expect quick replies!!!  The code is NOT finished yet, maybe by the end of the weekend.  I would like your thoughts on this method.

Tuesday, February 12, 2013

IIROC and CIPF

Here is some information that might help out the person wishing to open an investment account in Canada. 

Protection and regulation are really two different things, depending on what you mean when you say “protection”. I define protection (for the purposes of this post) to be protection of my personnel funds in the case of another MF Global or PFG Best.  Even if the regulator does not do their job (put your hand up American regulators!!!!) you will still get your funds returned to you. 
I was part of the MF Global non-sense, got every penny back, and it didn’t take very long either. I had an MF Global account that was registered in Canada.
Definitions
IIROC - Investment Industry Regulatory Organization of Canada.
CIPF - Canadian Investor Protection Fund.
IIROC is the Canadian Regulator.  CIPF Members are Dealer Members of IIROC.
Mission Statement: To contribute to the security and confidence of customers of Canadian investment dealers by maintaining adequate resources to return assets to eligible customers in cases where a Member becomes insolvent.


In the unlikely event that the Member you are dealing with becomes insolvent, CIPF will ensure the securities, cash and other property that are held in your account are returned to you in accordance with our Coverage Policy
Investment dealer insolvency doesn’t happen very often.  In fact, since CIPF’s inception in 1969 there have been only 18 Member insolvencies. CIPF has made payments of $36 million, net of recoveries, and no eligible customers have suffered a loss of property.

So, for anyone outside of Canada (except AUSA residents), take a look at this page.... it tells you what and who is covered under CIPF.

http://www.cipf.ca/Public/CIPFCoverage/ ... olicy.aspx

Does it matter if I do not live in Canada, or if I am not a Canadian citizen or a Canadian resident?

No. CIPF coverage does not depend upon residency or citizenship. CIPF coverage is available to you when you open an account with a CIPF Member.
If you are living in the USA, forget it.  The U.S regulators are soooo terrible that they demand your money stays inside the U.S.  Imagine if this rule didn't exist, there would be a whole lot of American funds being transfer outside the country.  Other countries respect the regulator so they don't open accounts for Americans.  I have money sitting in the bankruptcy case with PFG – so I don’t have anything good to say about the US financial system. 

Tuesday, August 28, 2012

Canadian Forex Accounts

If you have the option to open an account in Canada for Forex, you will gain a great protection plan!

IIROC is the regulator in Canada, here's the blurb from there site.

Investment dealer insolvency doesn’t happen very often, but if it does, the Canadian Investor Protection Fund (CIPF) is here to ensure your cash and securities are returned to you, within defined limits.

If you have an account with a CIPF Member you have CIPF protection - coverage is automatic for all eligible customers. For more information, go directly to our Coverage Policy.CIPF is sponsored by the Investment Industry Regulatory Organization of Canada (IIROC) and is the only compensation fund approved by the Canadian Securities Administrators for IIROC Dealer Members. All IIROC Dealer Members are CIPF Members.

So, for anyone outside of Canada, take a look at this page.... it tells you what and who is covered under CIPF. http://www.cipf.ca/Public/CIPFCoverage/ ... olicy.aspx

The sad part for US residents is that the Canadian regulator respects the US regulaor.  US regulator does not allow US residents from opening accounts outside the US.

From the CIPF web site

Question: Does it matter if I do not live in Canada, or if I am not a Canadian citizen or a Canadian resident?

Answer: No. CIPF coverage does not depend upon residency or citizenship. CIPF coverage is available to you when you open an account with a CIPF Member.

Canadian Brokers offering MT4


FXCM uses a company called Friedburg Direct.  I have an account with them.  Here is the MT4 FXCM page.
Over 5K you also get a free VPS. 1:50 leverage - and that's OK with me!! 


I know that Questrade is going to be introducing MT4 some time in the near future. 


Forex.com (Gain Capitol) - good spreads. free VPS with 5K or more.

Saturday, January 14, 2012

Canadian Forex Broker and MT4 – Questrade

Questrade offers MetaTrader 4 (MT4)
You heard it here first.
So after MF Global closed up shop I started looking for another broker.  I’ve already posted a little bit about this in the past month.  I want this broker to be covered under IIROC and CIPF.  MG Global was a member of CIPF and if they default on getting my money back to me, CIPF would have stepped in and refunded me 100%.  That wasn’t necessary, KPMG successfully got all the money back to me via a check mailed to me. 
I’ve tried FXCM and the Canadian broker they hooked up with called Friedburg Direct.  Well this set up is bullshit, you can’t open a MT4 account, you have to use FXCM-UK.  So after sending in the application and going through the process, the sale guy, YET AGIAN, was wrong wrong wrong wrong.  The lesson here is to call customer service of the parent company (usually US for the ones I was contacting), then new accounts, then customers service, get three different people to confirm the account set up.  Then call customer service in Canada and see if you get the same answer.  So I’ll probably open a small account to test new EA’s in a live platform.
I’ve been using Interactive Brokers and Questrade as well as TD Waterhouse (not to be confused with TD Ameritrade). 
Well TD sucks since the commissions are high, the platform is crap, and to get bracket order you have to pay to use the pro platform.  So those accounts are being moved now.
Interactive Brokers – great commissions, TWS platform is fine and very robust.They don’t allow RESP or RRSP but I do have an account with them.  To bad about the RRSP, had to find somewhere else for that, so I use Questrade.  BTW Trade Freedom was bought by some other company. 
So I’ve been with Questrade for a while now.  There basic platform is crappy too.  There is a new platform coming out shortly, I need to check to see if it will do OCA or bracket orders.  The big news here is they are covered under CIPF, regulated by IIROC, and they are BETA TESTING MT4.  Is that da bomb or what?
So I am about to start demo testing MT4 with Questrade.  I’ll keep you posted.

Wednesday, December 14, 2011

MF Global

I had an account with MF Global Canada, they went tits up as you are probably aware.  I actually got 100% of my money back, KPMG handled the deal!!.  The account was with the Canadian branch so I was covered under the Canadian protection fund that was set up years ago to deal with this type of non-sense.  So if you look at my forex performance, you'll see it has stopped trading.  I will be set up with a new broker and funded account by Christmas but I wont trade until January when liquidity is up.

Tipster Trendlines for MT4

I use the Forex Factory and the Steve Hopwood forex forums mostly.


If your looking for the MT4 Tipster Trendlines code, go to Steve's site as I'm not posting it at Forex Factory any longer.


www.stevehopwoodforex.com


You have to sign up to be able to download files.

Monday, July 4, 2011

Forex Contest

Alpari UK started up this years forex contest.  It's free and offers 20K of prizes.
I've already signed up for it, under the name AnotherBrian, account number 28353.
If you want to see where I stand in the league table, here is the link, enter the account number in the search box.

Here's the link to register.

Alpari Forex Contest

Good luck!

Wednesday, June 29, 2011

Tipster SR

So I made a system a while back for MT4, based on support and resistance.  I backtested it and studied it to learn the strenghts and weakness.  I've been demo testing it for about 4 months with good results, its not the grail but it trades without causing platform errors and long term produces some gains. 

On MTI Live, it was running on Anotherbriandemo, you can see it in the comments of the published statement on the MTI site.  It's now running on my real account.  I've adjusted the published statement start date of the Anotherbrian MTI Live account to be the same time I started using it.  I also use two other trading strategies on this account.  ForexMorningTrade and dicretionary trading based on Sam Seiden. 

FMT - I use this as more of a scalper with small lot size - this is like a real account test - I didnt back test it.  I watch it the day it trades to see if I should close it or not. 

Sam Seiden - I usually use a 1 or 4 hour chart for this.  This strategy requires patience.  In order to help me with that, I found having a robot running kills most of the urge to trade, so I can wait as long as it takes.

So, time will tell.

See the right side bar for performance or visit these links
Demo MTI Account
Live MTI Account

For the longest time I've been breakeven or losing slowly.  For the past severla months I've been working on EA's and watching them, and trading myself.  I think I found what works for me, as overtrading is a problem.  Let's see what happens!!  Join the MTI competition for some fun.... it's outlined in the post below.

UPDATE (July3, 2011):  The MTI Live website doesn't seem to show things as they really are unless you include ALL history.  I haven't figure it out yet (how to correctly show stats from a certain day forward).
The Tipster SR EA is LIVE.  It's one of the 3 EA's running on my live account.

Friday, April 29, 2011

Calling All Robots v2

This is a re-post.  The first competition had some technical issues with the rules I set up so I stopped it and created another one.  Join in!!

If you use MT4 (or MT5) and trade forex I invite you to join this free contest. The winner gets bragging rights.

I use MTi to track my performance of both live and demo account. My demo account is running a robot and MTi allows me to see the trade stats. They recently added a new feature called "Competitions". I've started a new competition and I invite you to participate. It's called "Calling All Robots"

To enter you need MT4, and an account with MTi. It's easy to sign up. Once you've signed up you download this and install, it installs automatically. You disable the FTP feature in MT4 options as this new file will upload all the trades to MTi. It's pretty slick.

The competition is scheduled to run from Fri, 27 May 2011 14:08 GMT to Wed, 1 Jan 2020 16:00 GMT
Basically, forever!


Rules The competition is open to both live and demo accounts.

  • All accounts must be in USD.
  • The maximum size of any individual order is 5.00 lots. Competitors will be disqualified if they place an order larger than this during the competition.
  • The maximum volume traded during the competition is 10.00 lots. Competitors will be disqualified if the total volume on trades during the competition is larger than this.
  • Competitors must not make deposits or withdrawals during the competition.
  • Performance is measured from the first equity figure published by your trading software after the competition starts to the last equity figure published before the competition ends.
  • Competitors must publish from the same broker account throughout the competition.

Leader Board


AnotherBrian is my real account.
AnotherBriandemo runs a robots, or robots, on test.  Most robots are of my own making.

I also have started another competition, "Perpetual Trading", its for real accounts only and runs for a long, long time.

Wednesday, September 15, 2010

BOJ Intervention

What happens when a countries bank intervenes on the currency market? This happens...


107 pips in 10 minutes USDJPY
218 pips in 3 hours USDJPY

USDJPY 1 Minute Chart

I was lucky on this one, real lucky. I had an order in on two different pairs and got in right at the bottom of the move.


For this trade, I waited for price to breakout of the down sloping trendline, then placed an order to buy when it returned to the same line. The little arrows on the chart is the pending buy limit order changing with each new bar. Timing is everything? I think it was just luck this time.


This trade was planned days before the event. I watched price approach the trendline and thought about cancelling the order as a move this fast was sure to run out of energy. I quickly looked at the forex calendar for news releases and there was none. Then I checked headlines, BOJ intervention confirmed. I left it to enter and was rewarded.

The red lines on the chart are my stops that were moved up to trail price action. I had to call it a night so I moved it closer. Nice!.

Final result:
EURJPY 229 pips captured
USDJPY 66 pips captured

It doesn't really matter WHY at the moment, trade what you see. This morning I found out WHY. BOJ stuffed 17 billion into the currency market, and really the only currency that moved were the JPY crosses.

Did anyone else make any pips? Let's hear your story.

Friday, August 27, 2010

USDJPY

In the coming weeks I'm going to be following the forex pair USDJPY from a purely technical perspective. It has been said that the government may step in to balance the currency as it approaches the low it set in April 1995. Below is the chart I've marked up with trendlines and the 1995 support zone.


I will be trading two different timeframes, the daily (with the weekly as reference) and the 4 hour. The four hour will attempt to capture small moves. The daily, I'll be looking to enter in the blue zone on a retracement. I'll be using my IB account for the longer term trades and MT4 with my forex broker for the smaller moves.

Sunday, June 27, 2010

Metatrader Forex Data and back testing

I finally found a source for free forex data that is complete, and FREE!

Here is the link to the file - Metatrader Free Forex Data

And the recommended set-up to back test your EA on MT4, follow this link

Set up for back test

There are other helpfull articles on that website also. I took a look at the two systems they are offering for sale and they don't fit my style. I like smooth equity curves. One of the systems has a 30% win rate, I like small gains with high win rates.

Sunday, October 18, 2009

EURUSD

The last post on EURUSD talked about some basics and a short update as price was playing with the trend line. I am currently long and I plan on holding for the ride.


WEEKLY CHART
From the weekly chart we can clearly see that price has entered an "air" zone, there is no meaningful resistance on the way up to the top of the yellow box.


Daily Chart - Long History
The last time price had to overcome resistance it popped through the orange trend line on the third attempt (yellow circle). Price followed the upward red trend line and is still following it. More on this line later on.... We just broke the blue trend line, and as it happens, on the third attempt just like the prior break. No we are into the yellow free air space.


Daily Chart - Closeup
Price just broke through the blue horizontal trend line, on the third attempt, same as the last horizontal trend line break. The pullback after the breakout above the orange horizontal trend line came to the upwards trend line and the 50% retracement. Note that it did not come back to the orange trend line, indicating a strong upward trend following the red line. Keep this in mind when looking to enter on the recent break.


Intraday
The yellow area is the S/R "zone" from the weekly chart. It looks like we are clear for now. A good area to place a but LMT order would be at 1.4790 to 1.4844 for a low risk opportunity.


What's next?


Breaking the upward red trend line - This would only mean that the rate of increase or rise in price has slowed. Once it breaks through, look for it to come back to it and test it, then fall. No telling when this line will break.


Pullback - look for a pull back to the upward red trend line or the blue horizontal trend line. The best choice might be whichever one of those area also lines up with a fib level and a round number. I might even load up more on a pull back.


Be patient and wait for the pullback. If you need some help with pull backs watch this
Pullback Video.


Do you have a position right now? Are you planning on geting in on this move?

Monday, October 12, 2009

EURUSD

UPDATE
Looks like a false breakout to me. It could also be a shakeout but I dont think a shakeout is that easy in forex and given this is a well watched trandl ine, there are too many participants at this level to do that.


Original Post
I was looking at the EURUSD chart today, deciding how to play pair as it nears long term S/R. My son came into the room and asked me what I was doing. I explained the bar chart and told him that we could make lots of money if our prediction was right. I asked what he thought the chart would do, first taking no more than one minute to show him how prices bounces off previous S/R levels, showing him the trend lines and S/R lines I drew. His 30 second view into the future is attached below and I have to tell you, its as valid as any other.

I'm playing this as a breakout for one reason only, this level has acted as resistance four times already and there is upward pressure from a very long trend line. There are three outcomes I see in the next week or so;

1: Breakout and huge move to the upside because of the long term nature of the two trend lines.
2: Breakout and a failure within a few days, price will move back below the 1.4821 area in a classic 2B move and then tank over multiple weeks if not longer.
3: Price will bounce off this area and head lower, below the uptrend line, then we are moving sideways. until a low is broken.

BTW - I have used Tipster Trendlines to place my trades. Check out this AFL for Amibroker for placing error free trades. "Error free" refers to the task of placing the trade, it does NOT refer to a trading system. the AFL also offers a risk management tool.

In short - this is a great place to watch price and place a trade. In other words, don't waste your time trading in between S/R lines on your chosen time frame.

Not sure about the long term, I'm focusing on the weeks ahead. Just for kicks, I'm posting what a 9 year old boy thinks of this market.

Sunday, September 6, 2009

Forex Volume

If you have traded forex for more than a day you will now that there is no volume data since there is no central exchange. There are ways to guess at volume, which by the way will help you even though its an approximation. Since trading isn't an exact science, any data for volume is better than no data. When volume is read on a chart, say for stocks, we look for increasing or decreasing levels, or a spike on a breakout, and not a particular number.... only comparisons.

Forex data can be derived from tick data. I use this right now, the number of price changes from the IB data stream is counted and added until the bar closes, the afl uses the ibc.getrealtimedata function.

You could also use forex futures volume data, Amibroker will let you do this easily, but the market hours aren't the same from what I understand. I've never looked into this, so don't consider this as fact.

I ran across a site where forex futures data is taken from the CME website reports that are posted and available via ftp. The website is call evolution. I read some post at forex factory and it seems the site has been up for a couple of years. There doesn't seem to be a huge following, (which is good if you ask me).

I'll be taking a closer look at the max volume levels for the past week and keep an eye on them. Use this with your support and resistance and we will probably find more clues to where the next bounce will happen.

Take a look and leave a comment here on the site, as well as your thoughts on forex volume.

Tuesday, June 2, 2009

USDCAD - Trade update

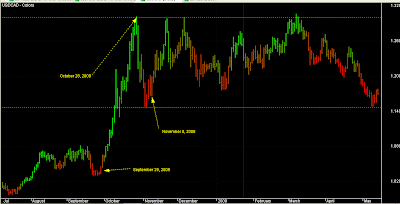
I closed my open short position on USDCAD the other day. I guess I didn't think that price would go as far as the completely obvious support level, shown below in red. The area between the two blue lines is void of any support/resistance.

I netted 461 pips on the trade.

Looking at the chart, you can see more totally obvious S/R levels. How about 1.3000? Two times it bounced off that level. See how the price looks sharp, quick up, quick down the first time it hits 1.3000? This tells us it's an important level. I missed both opportunities.

So whats next for this pair? If it blows past the red support line it should continue to the next red line. On the other hand, if it bounces off this red line it could move up to the top blue line.

I'll be ready.

Thursday, May 21, 2009

USDCAD - Look out below!

I've entered a short position in USDCAD. Why? Why not. The pair is at a major support level, a daily support level. I entered a few days ago, so I'm in profit and waiting to see what happens, and the best part is that I'm giving the market lots of room to move around, waiting for the decline.

Here are my previous thoughts on this pair, and where it would go
Notice on March 9, 2009 how the pair did penetrate the 1.3000 level and faked out breakout traders. Didn't I mention using a tight stop in an earlier post? I hope you didn't get caught on that one.
As I stated in an earlier post, I think the run up was due to the need for USD. Hedge funds had big clients who wanted out of the market, they could see the domino's falling after October of last year. To cash these guys out, the holding needed to be liquidated to some extent, including holding on non-USA markets. When they liquidate those holdings, the currency must be changed back to USD, so that drives up the price. There are clearly more forces at work than this, but I like the simple approach, all I need is in the price. And as I also stated before, understanding why something is happening is the downfall of many traders. You will know why many months later.

Credit Crisis and PUT option
If you do some creative searching on Google, you will find that there were those that shorted the market using PUT options before the credit crisis was public. Click on the link above to get started. So here is what I'm saying, you might have noticed this happening, and allot of traders did. How many acted? Notice the forum article, the writer is trying to figure out why? Who gives a rats ass why. Keep that in the back of your mind, like a dart in your back pocket, take it out when you need it. If you saw the market take a shit kicking like it did on November 8, 2008, you might have thought to wait a few days for a bounce, and pick up some PUTs. Or, you might have not because you wanted to know WHY? and didn't make a killing like the traders who sunk billions into PUTs. So, why ask why?

Looking at the charts below, notice on September 8, 2008 the USDCAD started to rally. Is this the impact of liquidating large amount of holdings? The pair tops out on October 28, 2008. So what do you think about that? At the time you would be asking yourself, why is it running like that? Stop asking, and make the trade. Even the hammerheads on CNN, BNN, and all the rest don't know what is going on. If they did, it would news.

Back to the USDCAD. It doesn't matter why it went up so fast. All I know is that the chart is telling me to short it. Be careful, manage risk, keep your capitol for another day if you are wrong. But if it cracks this support line, where is the next support? Keep looking down.

The other possibility of course is that it bounces a little and stays in this channel for the next 80 years. I'm playing the decline.

Here are the charts. Notice the daily support level at 1.1463 TO 1.1350.

Above = Daily chart
Below = Hourly chart

Saturday, March 28, 2009

USDCAD Poll

Previously I have posted my thoughts on USDCAD forex pair.

Shown below is the recent chart. Using all your skills, vote on which level you think will be breached first, the 1.3000 zone or the 1.1800 zone.
Vote on the poll - it's located at the top right side of the blog. Also, feel free to say your piece on the pair, commenting on this post.

Breakthrough

It's been a while since I posted. Here's what I've been doing, and not doing....

I haven't been working a whole lot on the updated version of Tipster Trendlines but it is close. I sent the code to a reader (David) who is testing it. David had some good ideas to improve the flexibility of the code. For example, the ability to submit a bracket order, or just a buy/sell order, or a buy/sell with a stop. Also, the menu's have changed with everything on a single pane.

Since the beginning of the year I thought I'd concentrate more on actually trading than coding trading systems reading/writing blog posts, and actually gain more experience trading every day.

Also over the past few months my frustration with IB's data feed has grown so I decided to try another broker for forex trading while still not closing the IB account. My issue here is that you cant get tick data. If I use another feed to Amibroker and IB to trade forex the two may not jive enough to scalp and/or place my stops. So I think we are kind of stuck with IB's crappy data feed.

I've opened a new account with MFGlobalFX to trade forex. I think they are an affiliate of FXCM since I can log onto the dailyFX website for news and signals (more on that later).

Their simple little platform is really all I need, I found to my surprise. I plot a few MA's and display a daily, H4, H1, M1, and tick chart to trade. Once I figured out what I wanted to see and what indy's I wanted to on my screen, trading was more simplistic. I only use price, MA's, slow Stochastic, and a table of ATR values. The platform is FXTradingStation by CandleWorks, does anyone else use this? The indicators are written in a language called LUA. I'm not about to dive into another language to port some indicators. So back it is to Amibroker. How do I get this new brokers data into Amibroker? ... more on that later....

Using this little platform made me think a little after I has some successful trades. Amibroker allows us to over complicate things. This simplistic approach helped me get my head around the trading plan that I needed to simplify. My plan was more than 10 pages and I really wanted a 2 pager, something I would memorise without even knowing it, something short. Also during that time I listened to a TraderInterview. This particular trader made up a simple "table", I call it a matrix, of his set-ups. He would detail the set-up for the applicable time frame and how to initiate a trade and possible profit targets. It is well known that a trader needs a few set-ups to draw from in order to flatten the equity curve, and this is a good visual tool to do that. This trader also scored the set-ups for each trade, promoting good set-ups and "firing" the under performers. Promoting just refers to increasing position size for the set-up. So this was my road map to simply my trade plan and my charts.

Back to the new forex account.... After I opened the account, I tried trading on the demo to figure out the platform. Easy stuff. Trade right from the charts. Then I went back to IB's TraderWorkstation and tried demo trading from the chart trader. Again, this was easy but the charts are not as nice but I can see through that by adjusting the colours. The worst part of IB chart trader is the lack of a tick chart. I have found scalping and setting trailing stops as my position moves to be so much easier with a tick chart.
Today I fired up the DDE link to FSXM with Amibroker and the data is now streaming. So at least I can set up some alerts to email me when price is getting close. If you are using FSXM and the FXTradingStation application let me know what you think of it. I was also wondering about sharing templates for that app, haven't found anywhere that does this.
This is the breakthrough. I ready to dump back tests and auto pilot systems for now. I've got risk management under control and I know my limits. A have some set-ups that I'm comfortable using. I have two issues left to solve and one is data availability / easy charting package, the other is to get comfortable with larger stops. The second will come , I think, with a larger account size, its all about percentage on the irsk side. The frst issue, charts, should be completed by Sunday night once the streaming quotes start to come in. I'll probably use Ami to look at tick data and some home grown indy's and use FXTradingStation for all other time frames and to place the trades. Tracking trades on FXTradingStation is also easy. I'd post chart shots bu the app wont open on the weekends when the servers are offline.
I'd be interested in knowing if anyone else uses a combination of Ami and FXTradingStation or Ami and FXCM to trade forex. What has your experience been?

Saturday, January 24, 2009

Currency Interest Rates

Now that I'm using the daily and weekly charts, with an entry planned off the 4 hour chart, I need to think about the interest rates of the various currencies.

Many brokers will credit or debit your account on overnight forex positions.
Interest is calculated using the difference between the two currency interest rates. For example if you trade Euro Dollar, the ECB (European Central Bank) and FED (Federal Reserve) are the banks you would need to look too for the current rates.. If the ECB's rate is 2.25% and FED's rate is 4.25% the difference is -2%. A long (buy) position on Euro Dollar will generate a 2% debit interest on your account, a short position will generate a credit interest of 2%.

To show you the impact of this, here are a few examples and a link to use this currency interest rate tool. This is also know as the carry trade.

You need to know what will have an impact on your trade, and what the impact will be in order to make an informed decision. Using the chart below yo can see that the interest is minimal for most small trades, but of coarse this depends on the pairs, the rates, and the length of time you are holding the trade open.
I'm using this tool to narrow down the pairs I will be trading, and noting in my trade plan the desired trade to be on the right side of the interest rate. This will help me make my decision to trade the pair without having to goto the tool every time. Part of the weekly ritual is to update that table, for the pairs I have chosen to trade.

1 week for $30,000


1 weeks for $100,000


4 weeks for $30,000

Disclaimer

The information presented on this site is for educational and entertainment purposes only. This site contains no suggestions or instructions that you must follow, do your own research and due diligence before committing your cash to the markets. Your on your own.