
Here is an interesting chart of USDCAD that automatically plots the highest high and lowest low for a pre-defined period. I like the chart automation but I don't really like the pre-defined period. I would like to have a period that adjust automatically but I'm not sure what I want to use for the basis of the adjustment. I was think about using volatility like ATR or perhaps SAR to determine the look back period. The formula uses the moving average cross of the highest high and lowest low, that's why some lines are longer than others.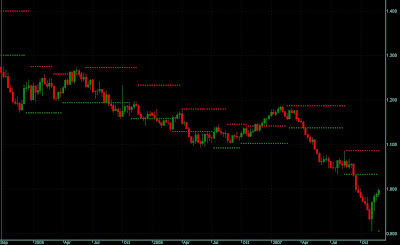
If you look closely and examine the chart, you can't really find a consistent pattern of support break through. I'm looking at the break through of support or resistance, specifically looking for a close above or below, and watching what happens to price.
The chart below has my special DOTS on it. This is a weekly chart. I'd say it still has some upward movement to work off. This week it briefly broke through the 1.00 level. About a month ago it hit 0.9054, what a profit that could have been eh? The weekly doesn't show any sign of this upswing weakening but the daily chart shows it's running out of gas. I'm going to wait for the downswing then jump on board.
A short using $2000 with 50:1 leverage at 1.0000 and covering at 0.9054 gives you some serious cash, not that this is possible but part of the move could be caught. The cash grab is about $10,000 for that move. It's nice to know the possibility. Remember, with this also goes that you could lose the $2000 just as fast. Practice risk management.
Friday, November 30, 2007
Highest High & Lowest Low
Subscribe to:
Post Comments (Atom)


Unequivocally, excellent message
ReplyDelete